
stira
Carbon accounting · Emissions management

Understand your footprint. Know what to do next.

Bring your emissions data, evidence, targets and reduction actions into one clear workflow, so the figures you report are the same figures you act on.

Stira is in development.Joining registers interest.No payment, no commitment.
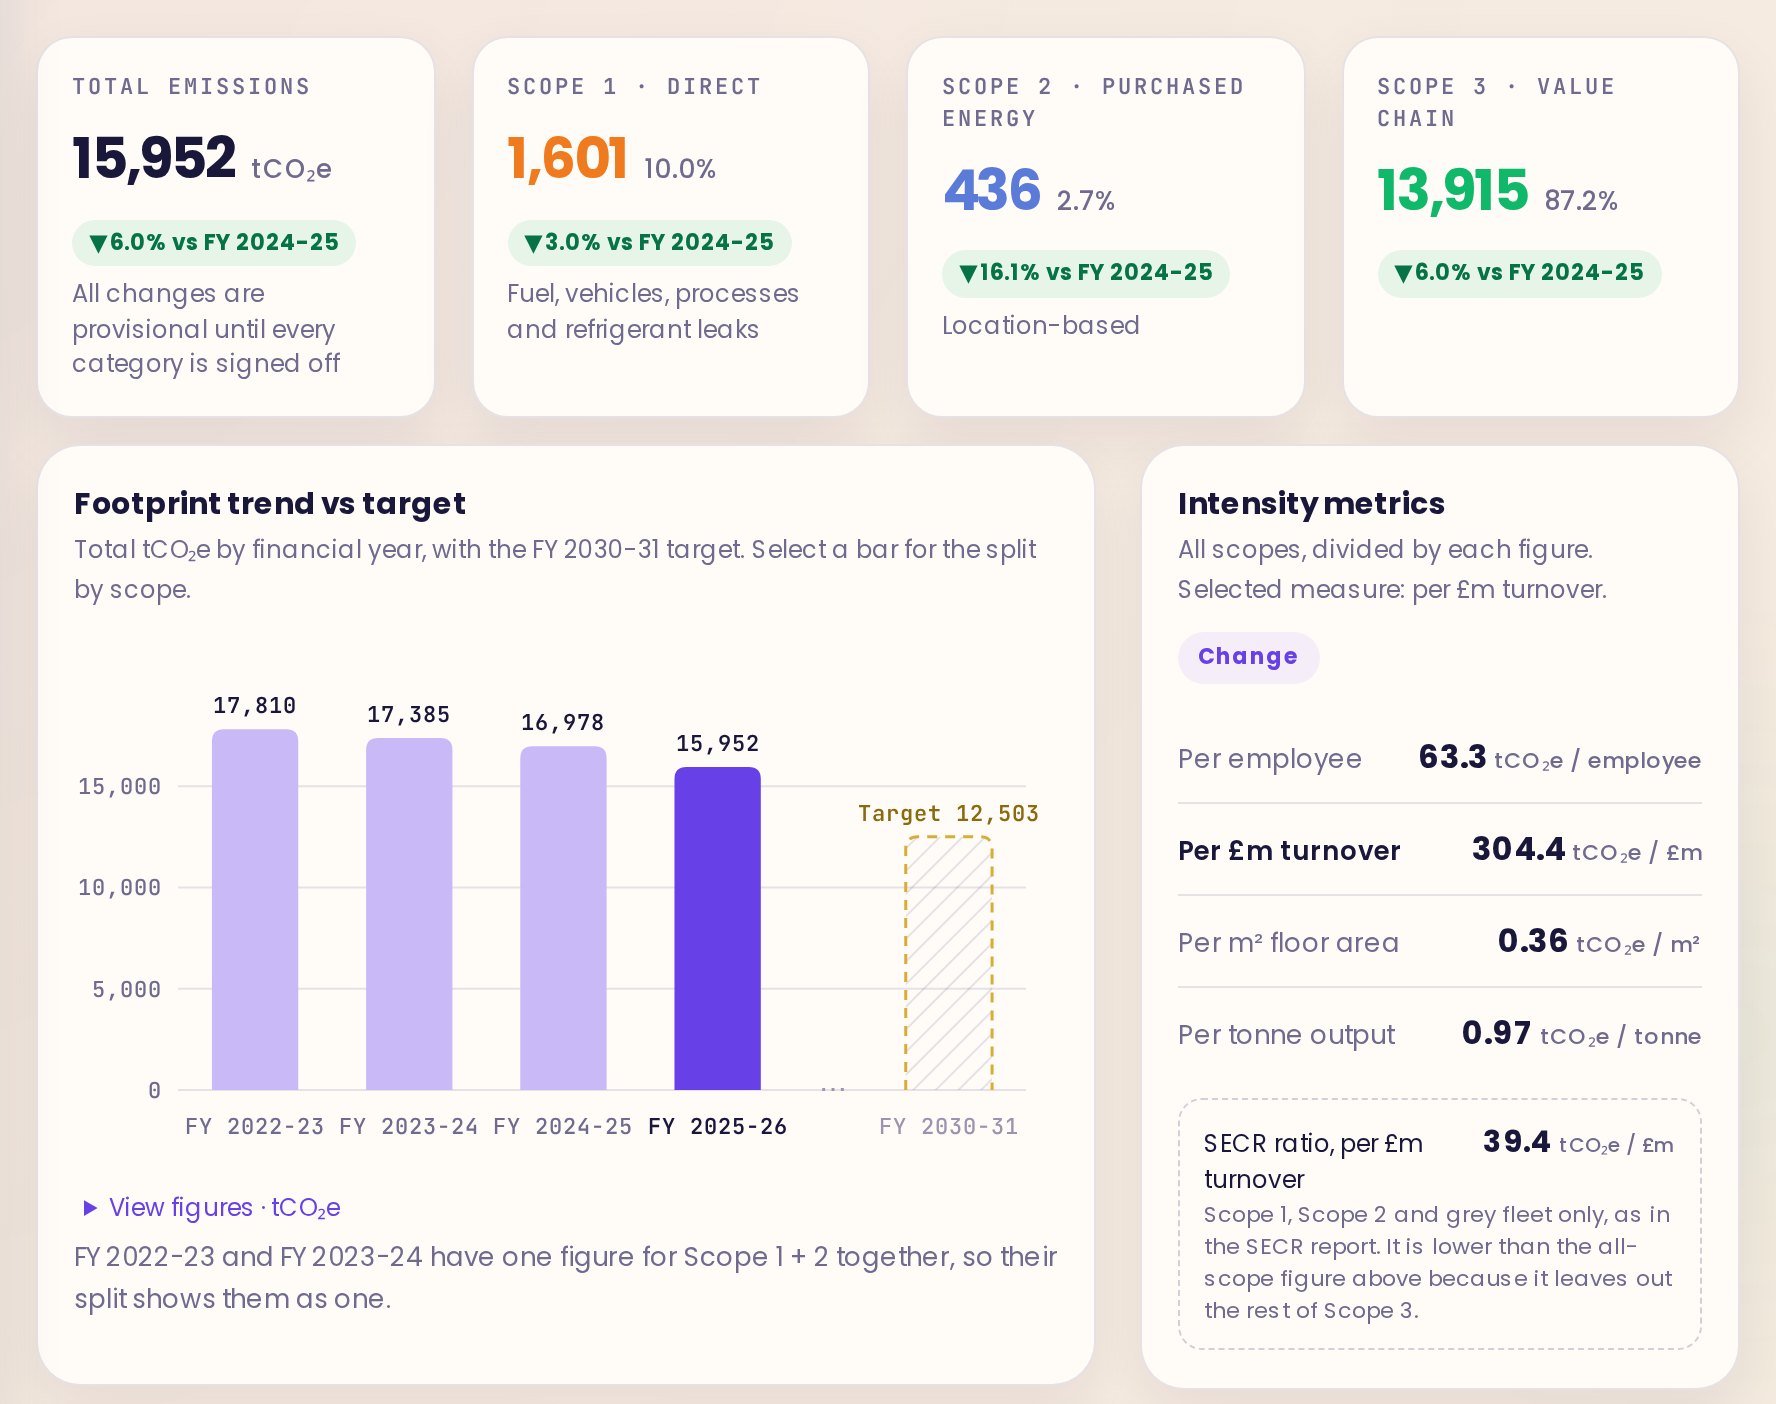
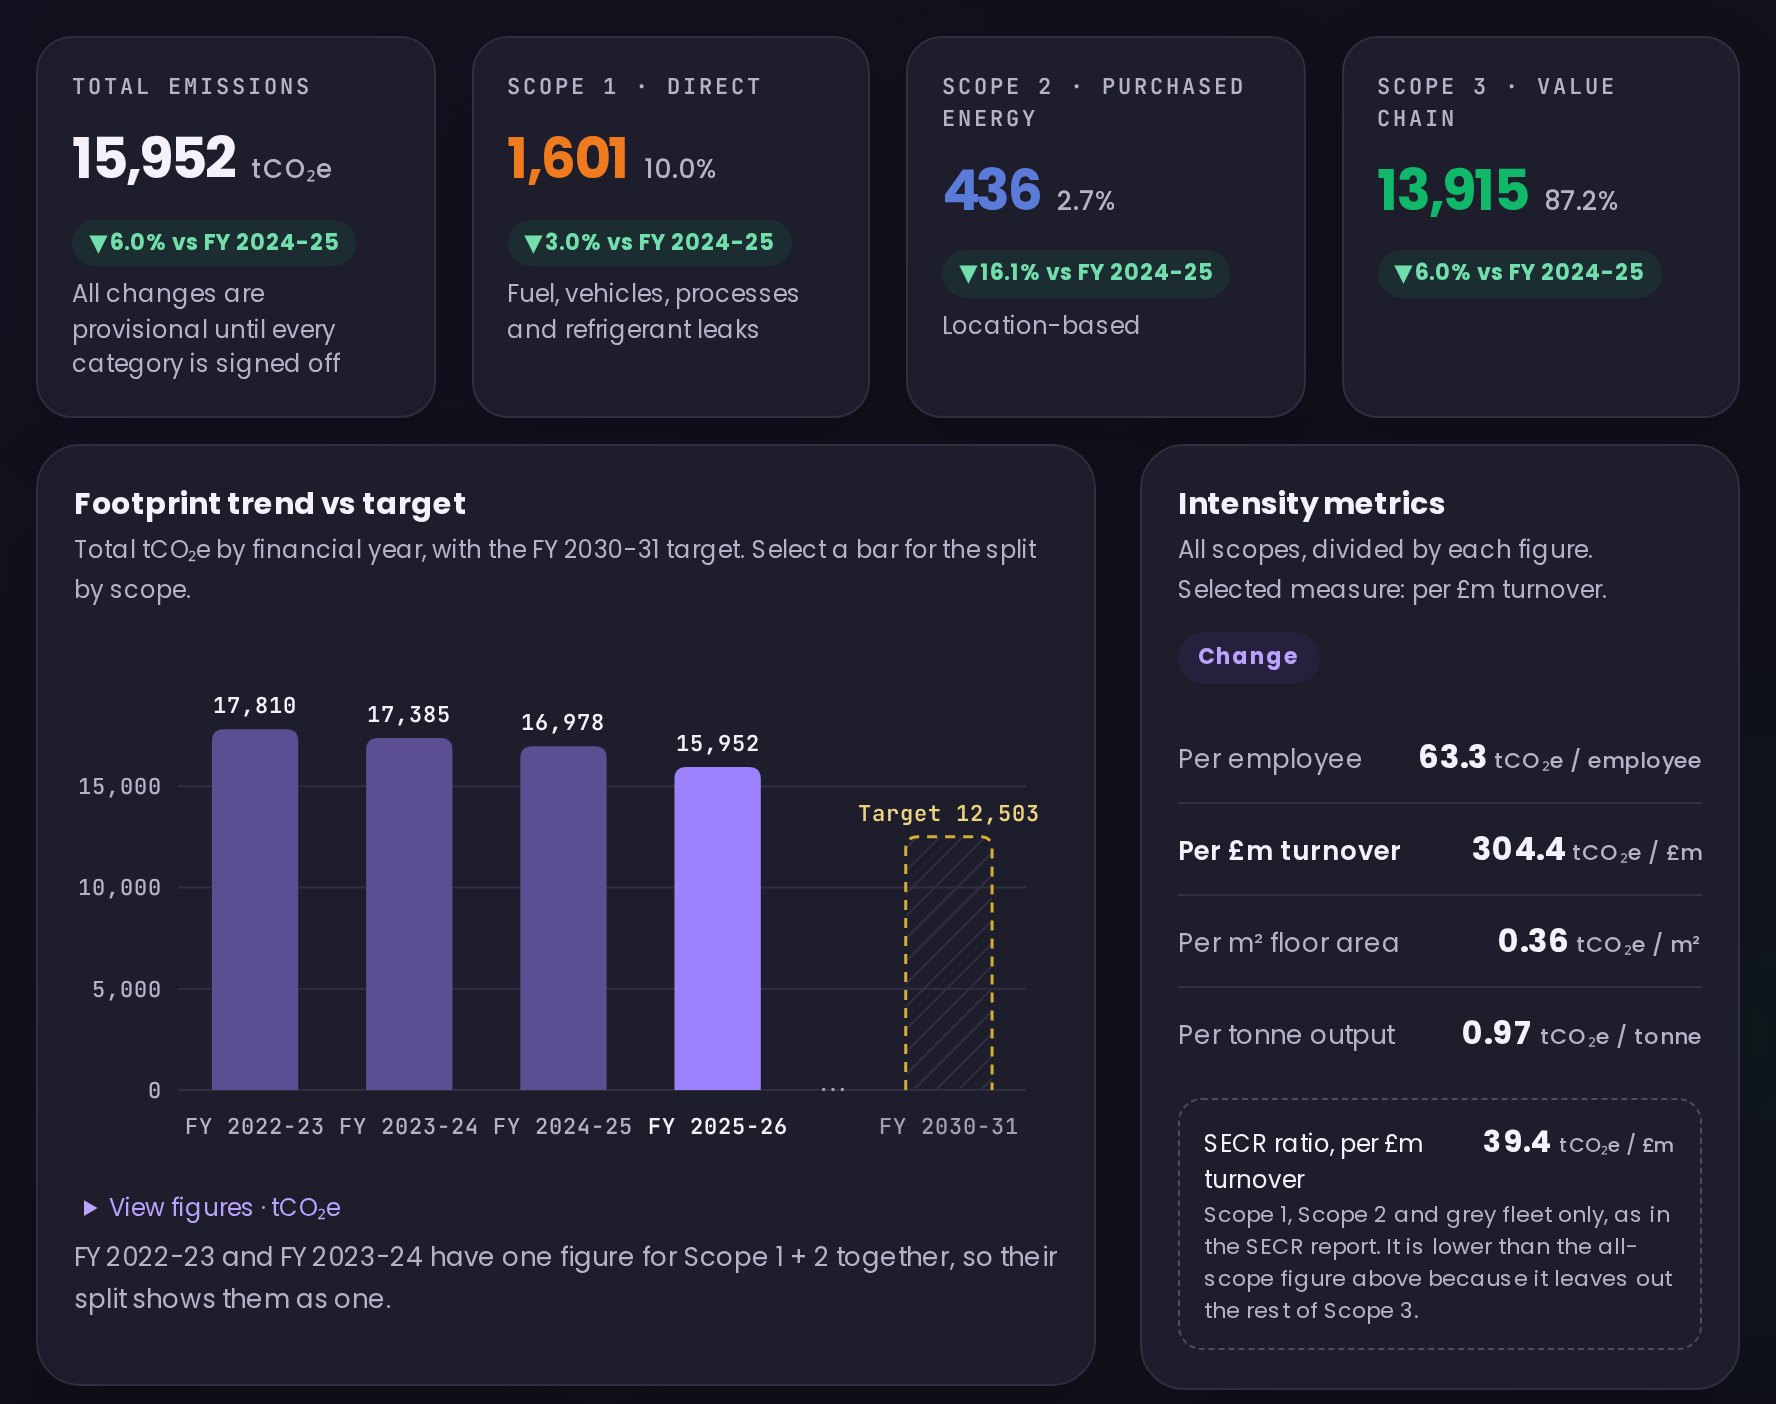
The Stira Overview for the demo company Ashwell Precision: 15,952 tonnes CO2e in FY 2025-26, split into Scope 1, 2 and 3, with a bar chart of four years against a 2030-31 target and intensity figures. The Stira Overview for the demo company Ashwell Precision: 15,952 tonnes CO2e in FY 2025-26, split into Scope 1, 2 and 3, with a bar chart of four years against a 2030-31 target and intensity figures.
One connected workflow

Stira connects the data behind your carbon report.

Every figure keeps its source. Follow one line from the bill to the report, the target and the plan.

ExampleElectricity at the main site, FY 2024-25
  1. Data
    2,511,500 kWhFrom 12 monthly bills
  2. Evidence
    12 bills attachedChecked and signed off by a reviewer
  3. Calculation
    520.0 tCO₂e× 0.20705 kg per kWh, DESNZ 2024 factor
  4. Reports
    Scope 2 in your SECR and GHG reportsThe same 520.0 t, linked back to the bills
  5. Targets
    Counted towards your Scope 1 and 2 targetProgress updates when the figure changes
  6. Actions
    Solar panels on the main siteSaves about 64 t a year, with an owner and a due date
The problem

Most emissions work stops at the report.

Stira connects the data behind your carbon report, so you can understand what matters and turn it into action.

01

Data lives everywhere

Meter readings, invoices, supplier spend and travel logs arrive in different formats, owned by different people.

Fuel and combustionStrong dataReady
Purchased electricityGood dataReady
Capital goodsSome estimatesReview
Purchased goodsNeeds better dataImprove
02

Evidence is hard to trace

When someone asks where a figure came from, the answer is often buried in an inbox or last year’s spreadsheet.

03

Reports don’t become plans

A finished report shows the footprint, but not which changes matter most, who owns them, or whether they’re on track.

04 · ACT

Put effort where it moves the number.

Hotspots rank categories by size, reduction potential and confidence. Turn one into an action with an owner and a date, and see how much of the gap to your target your plan covers.

One connected workflow

Measure. Understand. Act. Report.

01Scope 1 · 2 · 3

Measure

Collect emissions data across Scope 1, 2 and 3 and keep the supporting evidence with it.

02Hotspot view

Understand

See your total footprint, the trend over time and the areas where emissions are concentrated.

035 open actions

Act

Set targets and turn the biggest opportunities into actions with owners, dates and expected savings.

04Review

Report

Review the evidence, resolve comments and generate reports from the same trusted data.

Report

Everything behind each figure, in one place.

Keep the data, evidence and calculations behind every emissions figure in one place. Reviewers can check the evidence, leave comments and sign off, while reports are generated from the same trusted data.

Scope 2 · Purchased electricity520.0 tCO₂e
✓ Signed off
Data
2,511,500 kWh from 12 monthly bills
Evidence
12 bills attached
Method
Location-based, DESNZ 2024 factor, 0.20705 kg per kWh

ReviewerMarch looks low. Was it an estimate?

PreparerNo, it was a meter reading. The bill is attached.

Used inSECR reportGHG report
Who it’s for

Built around the people doing the work.

One calm workspace for the teams reporting emissions, and for consultants managing the same process across clients.

Business teams

Sustainability, finance and operations on one record.

Keep the reporting year, evidence and ownership together, so the number everyone sees is the number everyone can explain.

Shared inventoryClear ownershipReviewer-ready
Sustainability consultants

Move between clients without rebuilding the workflow.

Switch organisations, compare completeness and keep each client’s reporting work consistent from one place.

Client switcherPortfolio viewWhite label
Pricing

Clear pricing from the start.

Plans shown at monthly rates in GBP. VAT is added at checkout.

Starter
£90/ month

For a business bringing its first complete emissions workflow into one place.

For one organisationStarter workspace
3 usersincluded
  • Scope 1 & 2 + Scope 3 screening
  • Standard reports
  • Shared data and evidence workflow
Join the waitlist
Consultant
£740/ month

For consultants managing multiple client organisations from one workspace.

For multiple client organisationsConsultant workspace
Multi-client workspaceclient switcher + portfolio view
  • Everything in Professional
  • Client switcher, portfolio view & white label
  • Priority support
Join the waitlist

Prices shown as monthly rates in GBP. VAT is added at checkout.

Early access

Make the next reporting cycle feel less like archaeology.

Be first to hear when Stira opens. Registering interest is free and doesn’t guarantee access.

Name, work email and company are required. Everything else is optional.